My last few blogs and guides have been around security, however something I have been playing with and wanted to write about was PowerBI and more over, connecting PowerBI to your Car! In this article and I am going to go through the steps that I took to obtain the log data from my car and feed it into PowerBI to make an awesome looking dashboard!
A few things before we begin, most of this at the moment is pretty manual using static data, however I am working on ways to improve getting the log data into PowerBI or even to a central source like a SQL Database. I am also using PowerBI Desktop for this, as this is a free version that you can download from here (Looking to get a PowerBI Pro license soon so I can embed the dashboard into my site) . I am also going to assume that you have a base understanding of PowerBI and how it can be used to present data into usable information.
To capture data you will need the following:
- ODBII to Bluetooth adaptor (Can be googled and found on sites like Ebay)
- An Android phone (Not sure if iPhones are supported)
- Torque app from the Play Store
- PowerBI Desktop edition
Obtaining Car Log Data
The first step to this is obtaining the raw data, without data we have nothing to work with! So, in order to get the car data you will need 2 things: A Phone (Prefably Android for this) and a Bluetooth OBD2 Reader. Using these two components, you can access your cars OBD computer and use your phone to record the output logs, this can also be combined with things like your phone’s GPS co-ordinates to give you an idea of speed, as well as being able to plot your location on a map!
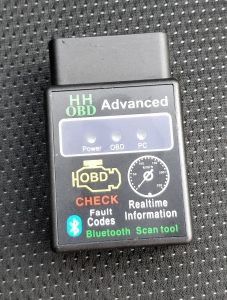
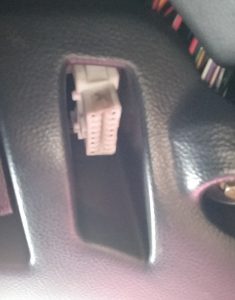
Once you have your OBD Reader, you will need to connect it via your Bluetooth. Please note: the OBD reader will need to be on before you do this, so go ahead and plug it in your car (You may need to google around for where your car’s OBD port is).
Once you have connected to the device, you will need an application from the app store in order to ‘talk’ to the cars ECU.
For this I used an app called Torque. It a simple to use app which can show you your car statistics. It can also clear and read error codes which is very handy to have! I paid for the full version, given how much this app has helped me (And saved me money wise).

Once connected, Torque will begin showing useful information.
We now need to dive into the settings and configure Torque to capture certain information into the log file, all we are doing here is defining which sensors should be logged into a .csv file.

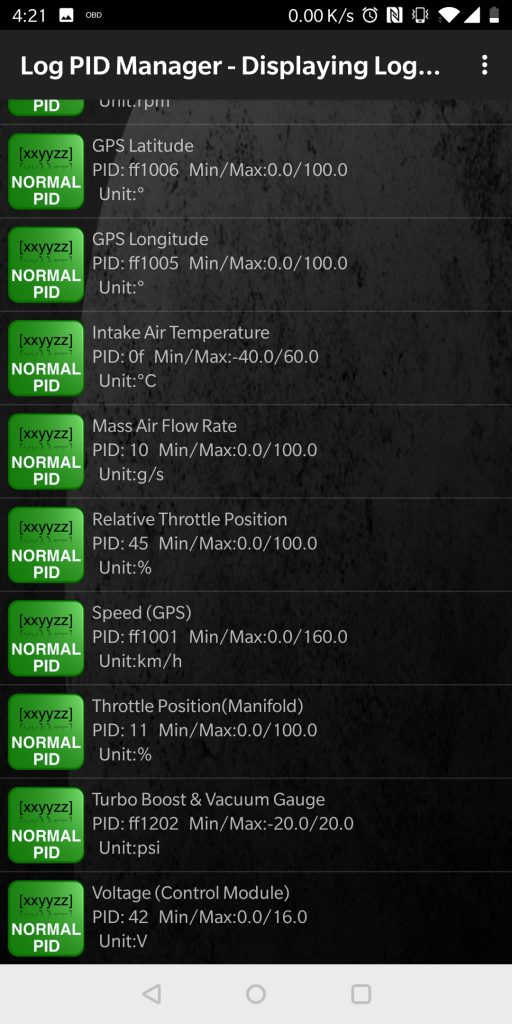
Once you have this setup, you can head back to the main dashboard (Where you can see the live data) and hit the settings, you can select start logging.
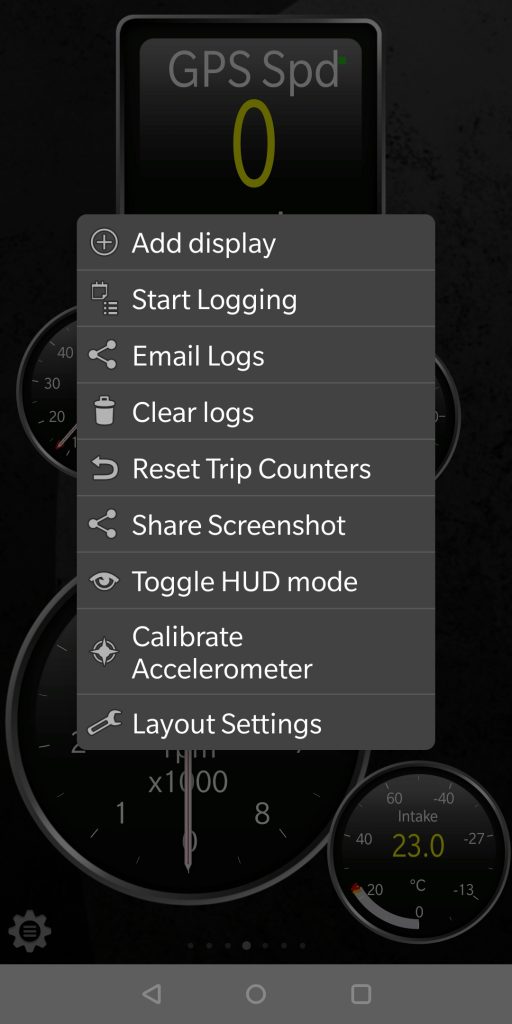
From this point forward, Torque will begin loggin all of the data that you have specified in the sensor options (Select what to capture). This can then be exported into a .csv file, which in turn can be imported into PowerBI.
One you have driven round the block or on the race track, you can stop and share the logging. I shared the log data (.csv file) to my Onedrive, although this is pretty static and manual there are methods of uploading the log data to a server. Below is the .csv file displaying the raw log data.
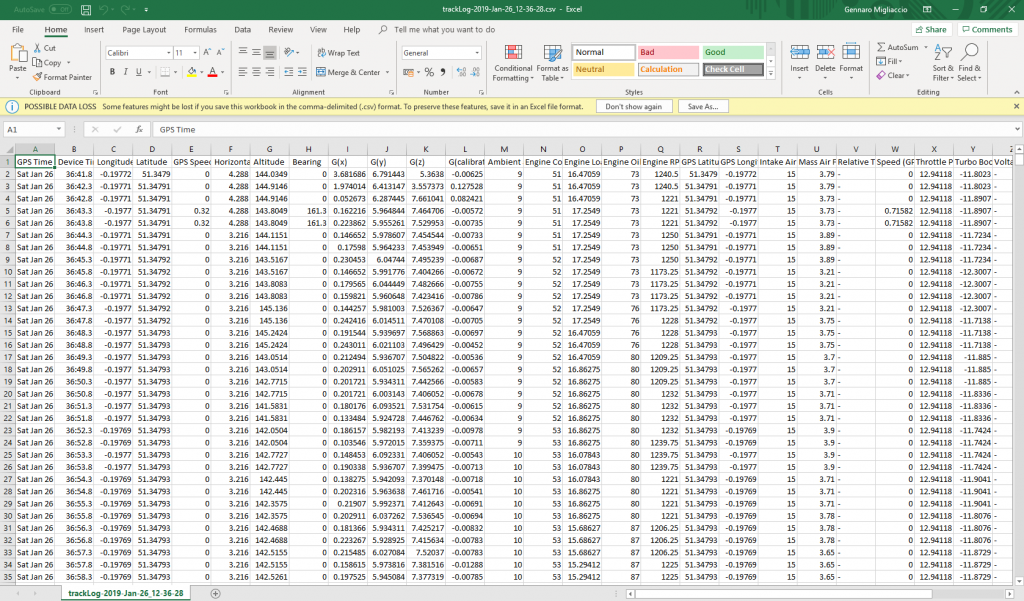
Notice the columns have all the selected data from within Torque. Its quite a log log, as each row is a 5 second interval. In this form, this data is pretty raw, so lets feed it into PowerBI to interpret it.
Importing into PowerBI
Load up PowerBI and locate the choose data source, you will need to point this to your .csv file.
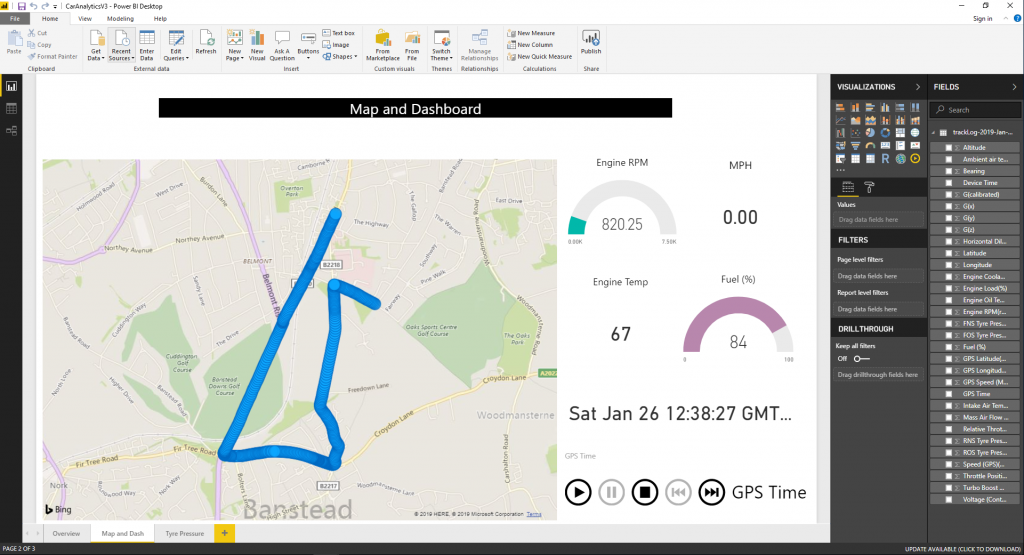
Once this is loaded into PowerBI, you can start making graphs, guages and map views with the data. For example, to build a map that shows my location against the time I would do the following:
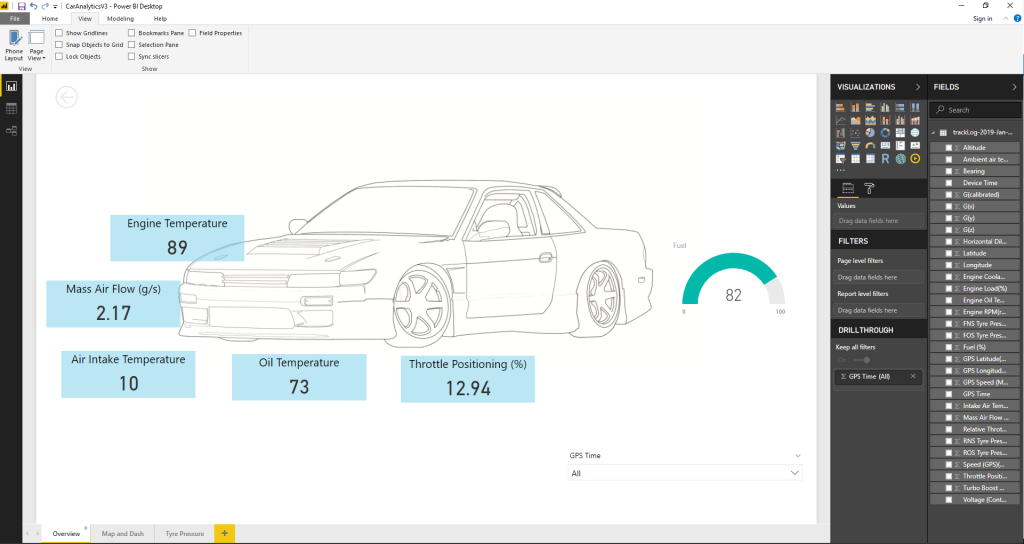
There are many combinations that can be done, I put together my dashboard with: A Map view, an overview of the car and current tyre pressure. These were are displayed in a simple format, but in the future I may add the drilldown functions into some of the data. Here are the dashboards I created:
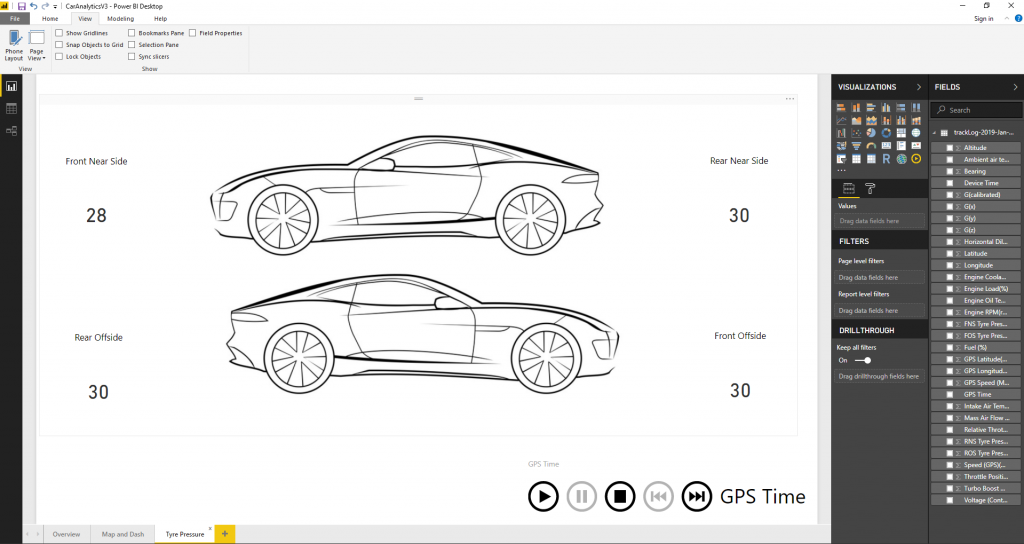
You can download the dashboard .pbix that I have created here. Please note, that for my dashboard I did import a custom individual called ‘PlayAxis’, this as you can guess, allows us to ‘play’ the data for the map and gauge effects. The PlayAxis custom visual can be found here, full credit to the guys that put this together!
The .pbix that I have posted will still have my track data loaded into it, this can be removed when you repoint/query the dashboard to your data. Or you could just use my data to play around with the dashboard!
This is going to be a working progress, so will be adding to this dashboard and updating the .pbix as I go along, any suggestions will be more than welcome! I will post any edits below.
Hi,
Does the raw csv data come exactly like displayed with rows and columns or does it show in the graphs.
I want it in row and columns.
Thank you
Hi Magie,
The .csv files comes as displayed as its the raw data from the sensors. You can add/remove more columns depending on the sensors that are available in your car.